2022-23 graduates
Master's graduates
n=203
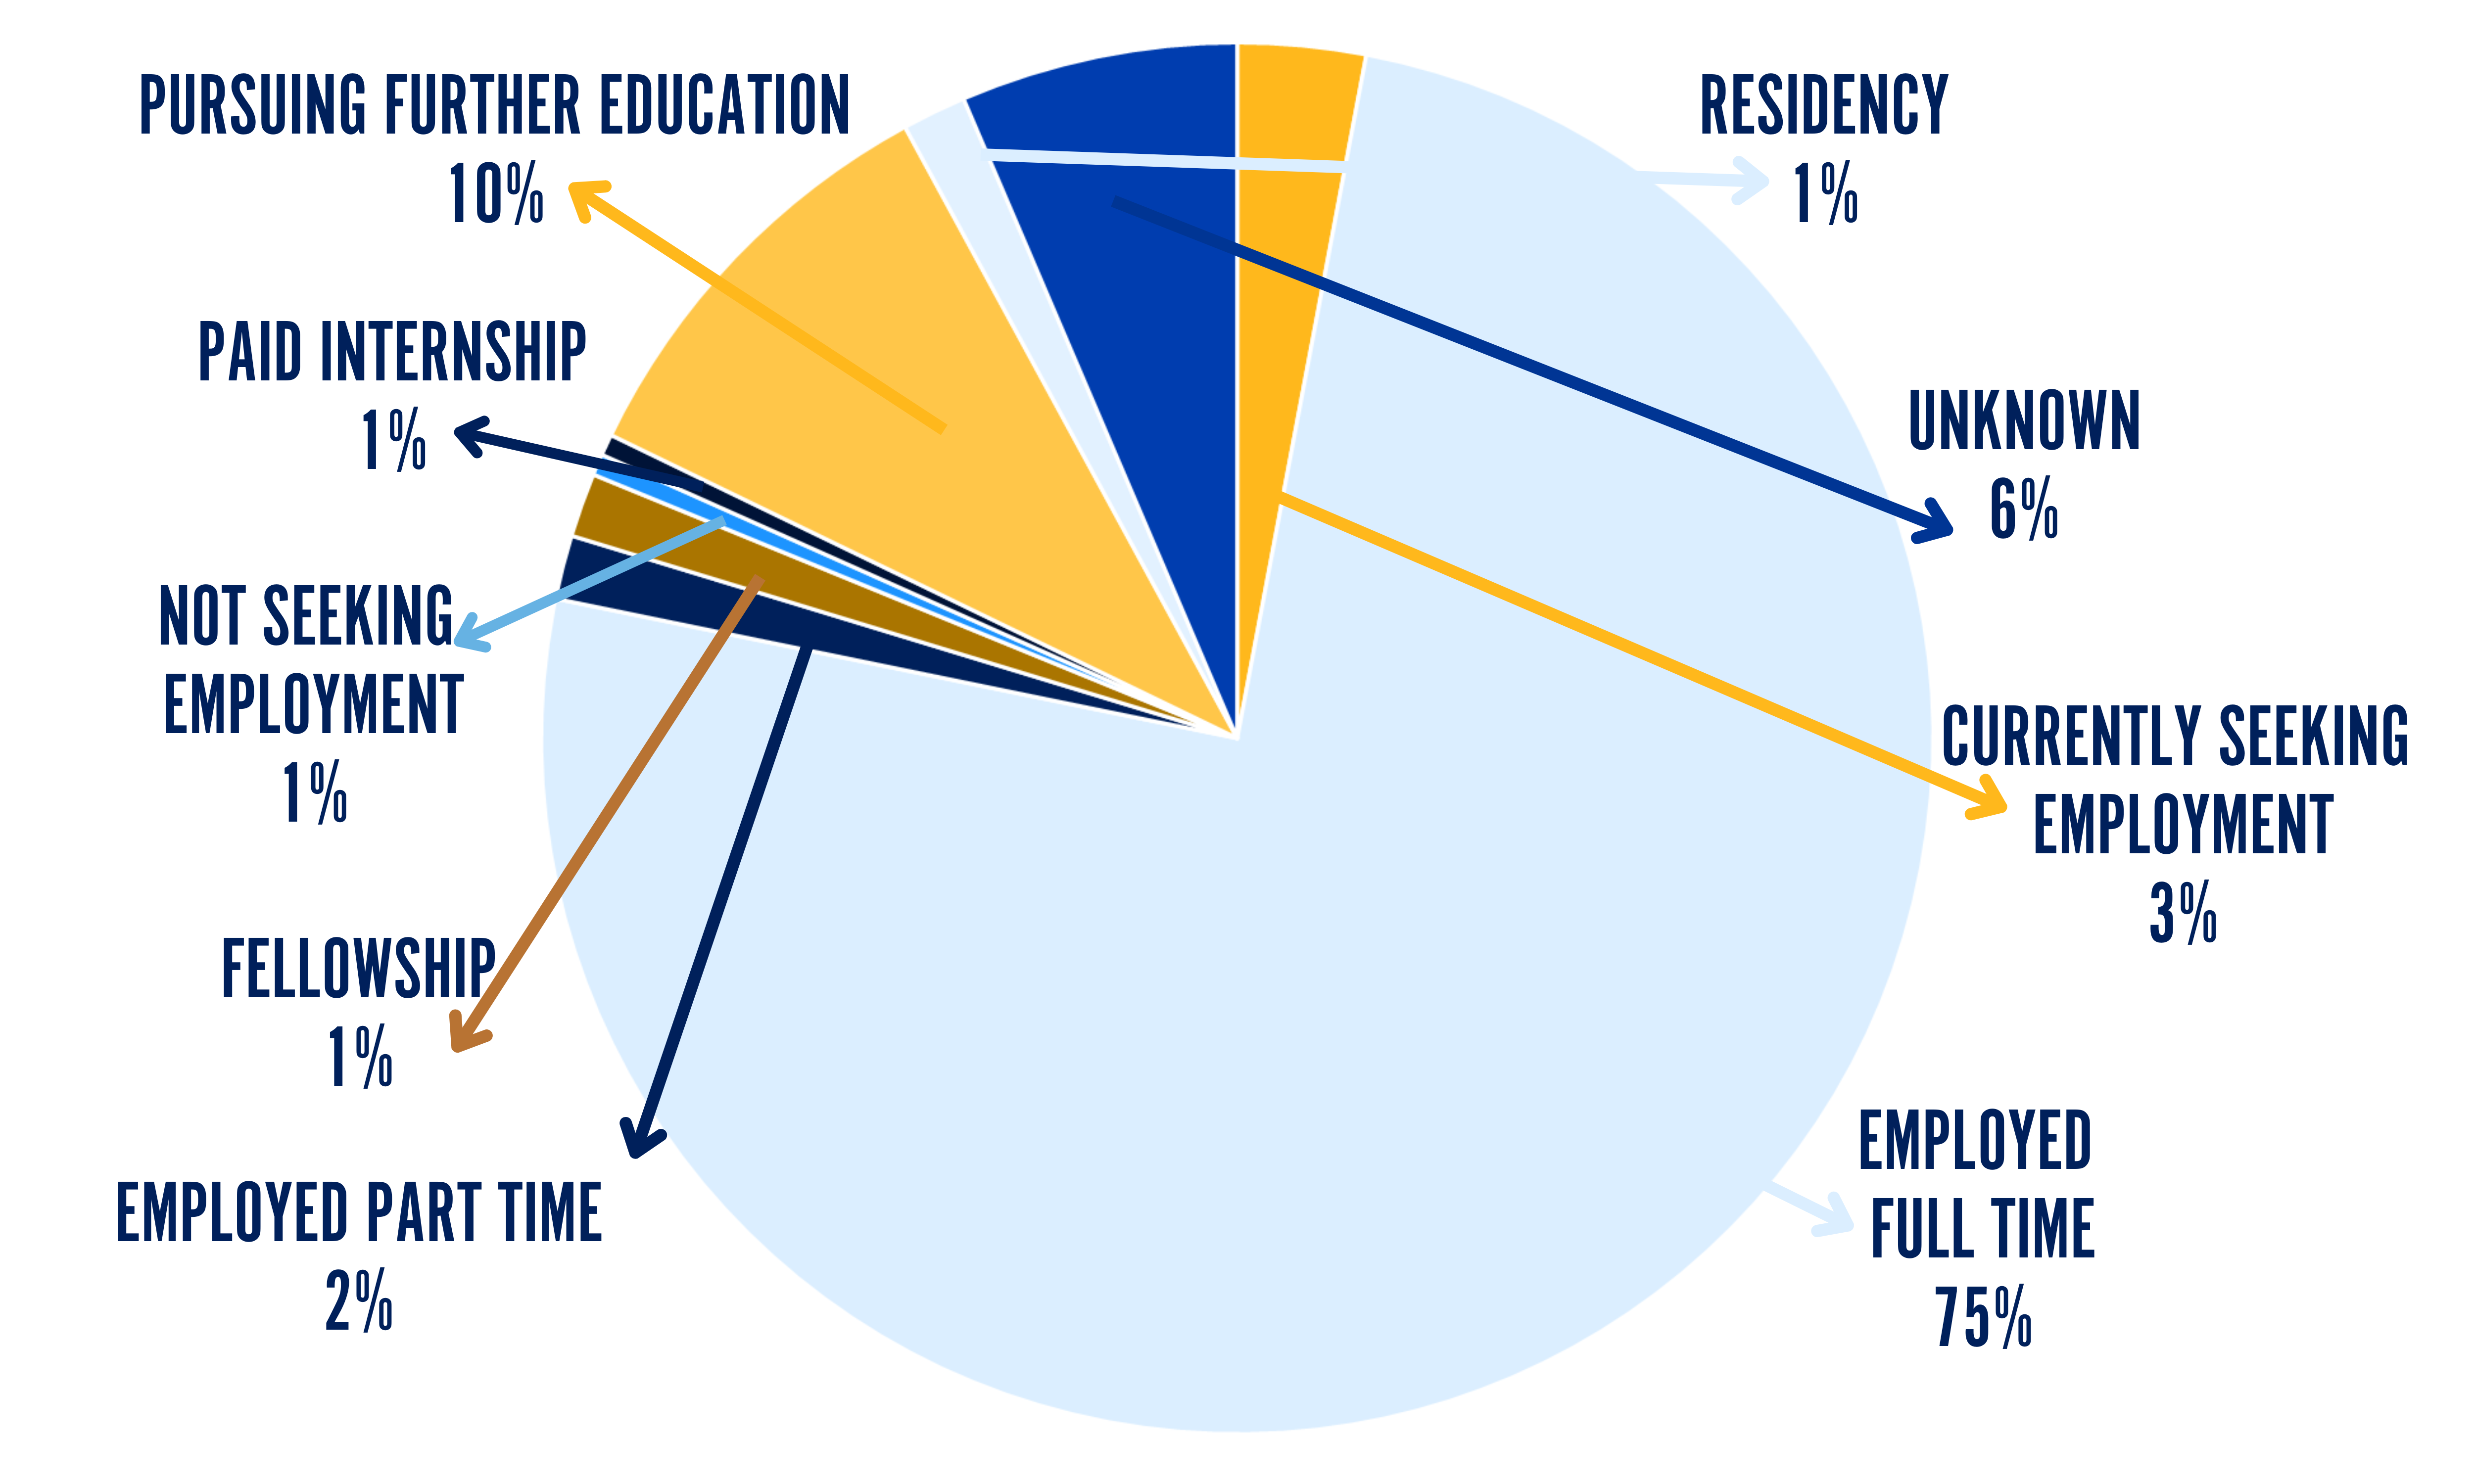
| Employed Full-Time | 75% |
| Currently Seeking Employment | 3% |
| Unknown | 6% |
| Residency | 1% |
| Pursuing Further Education | 10% |
| Paid Internship | 1% |
| Not Seeking Employment | 1% |
| Fellowship | 1% |
| Employed Part-Time | 2% |
Doctoral graduates
n=45
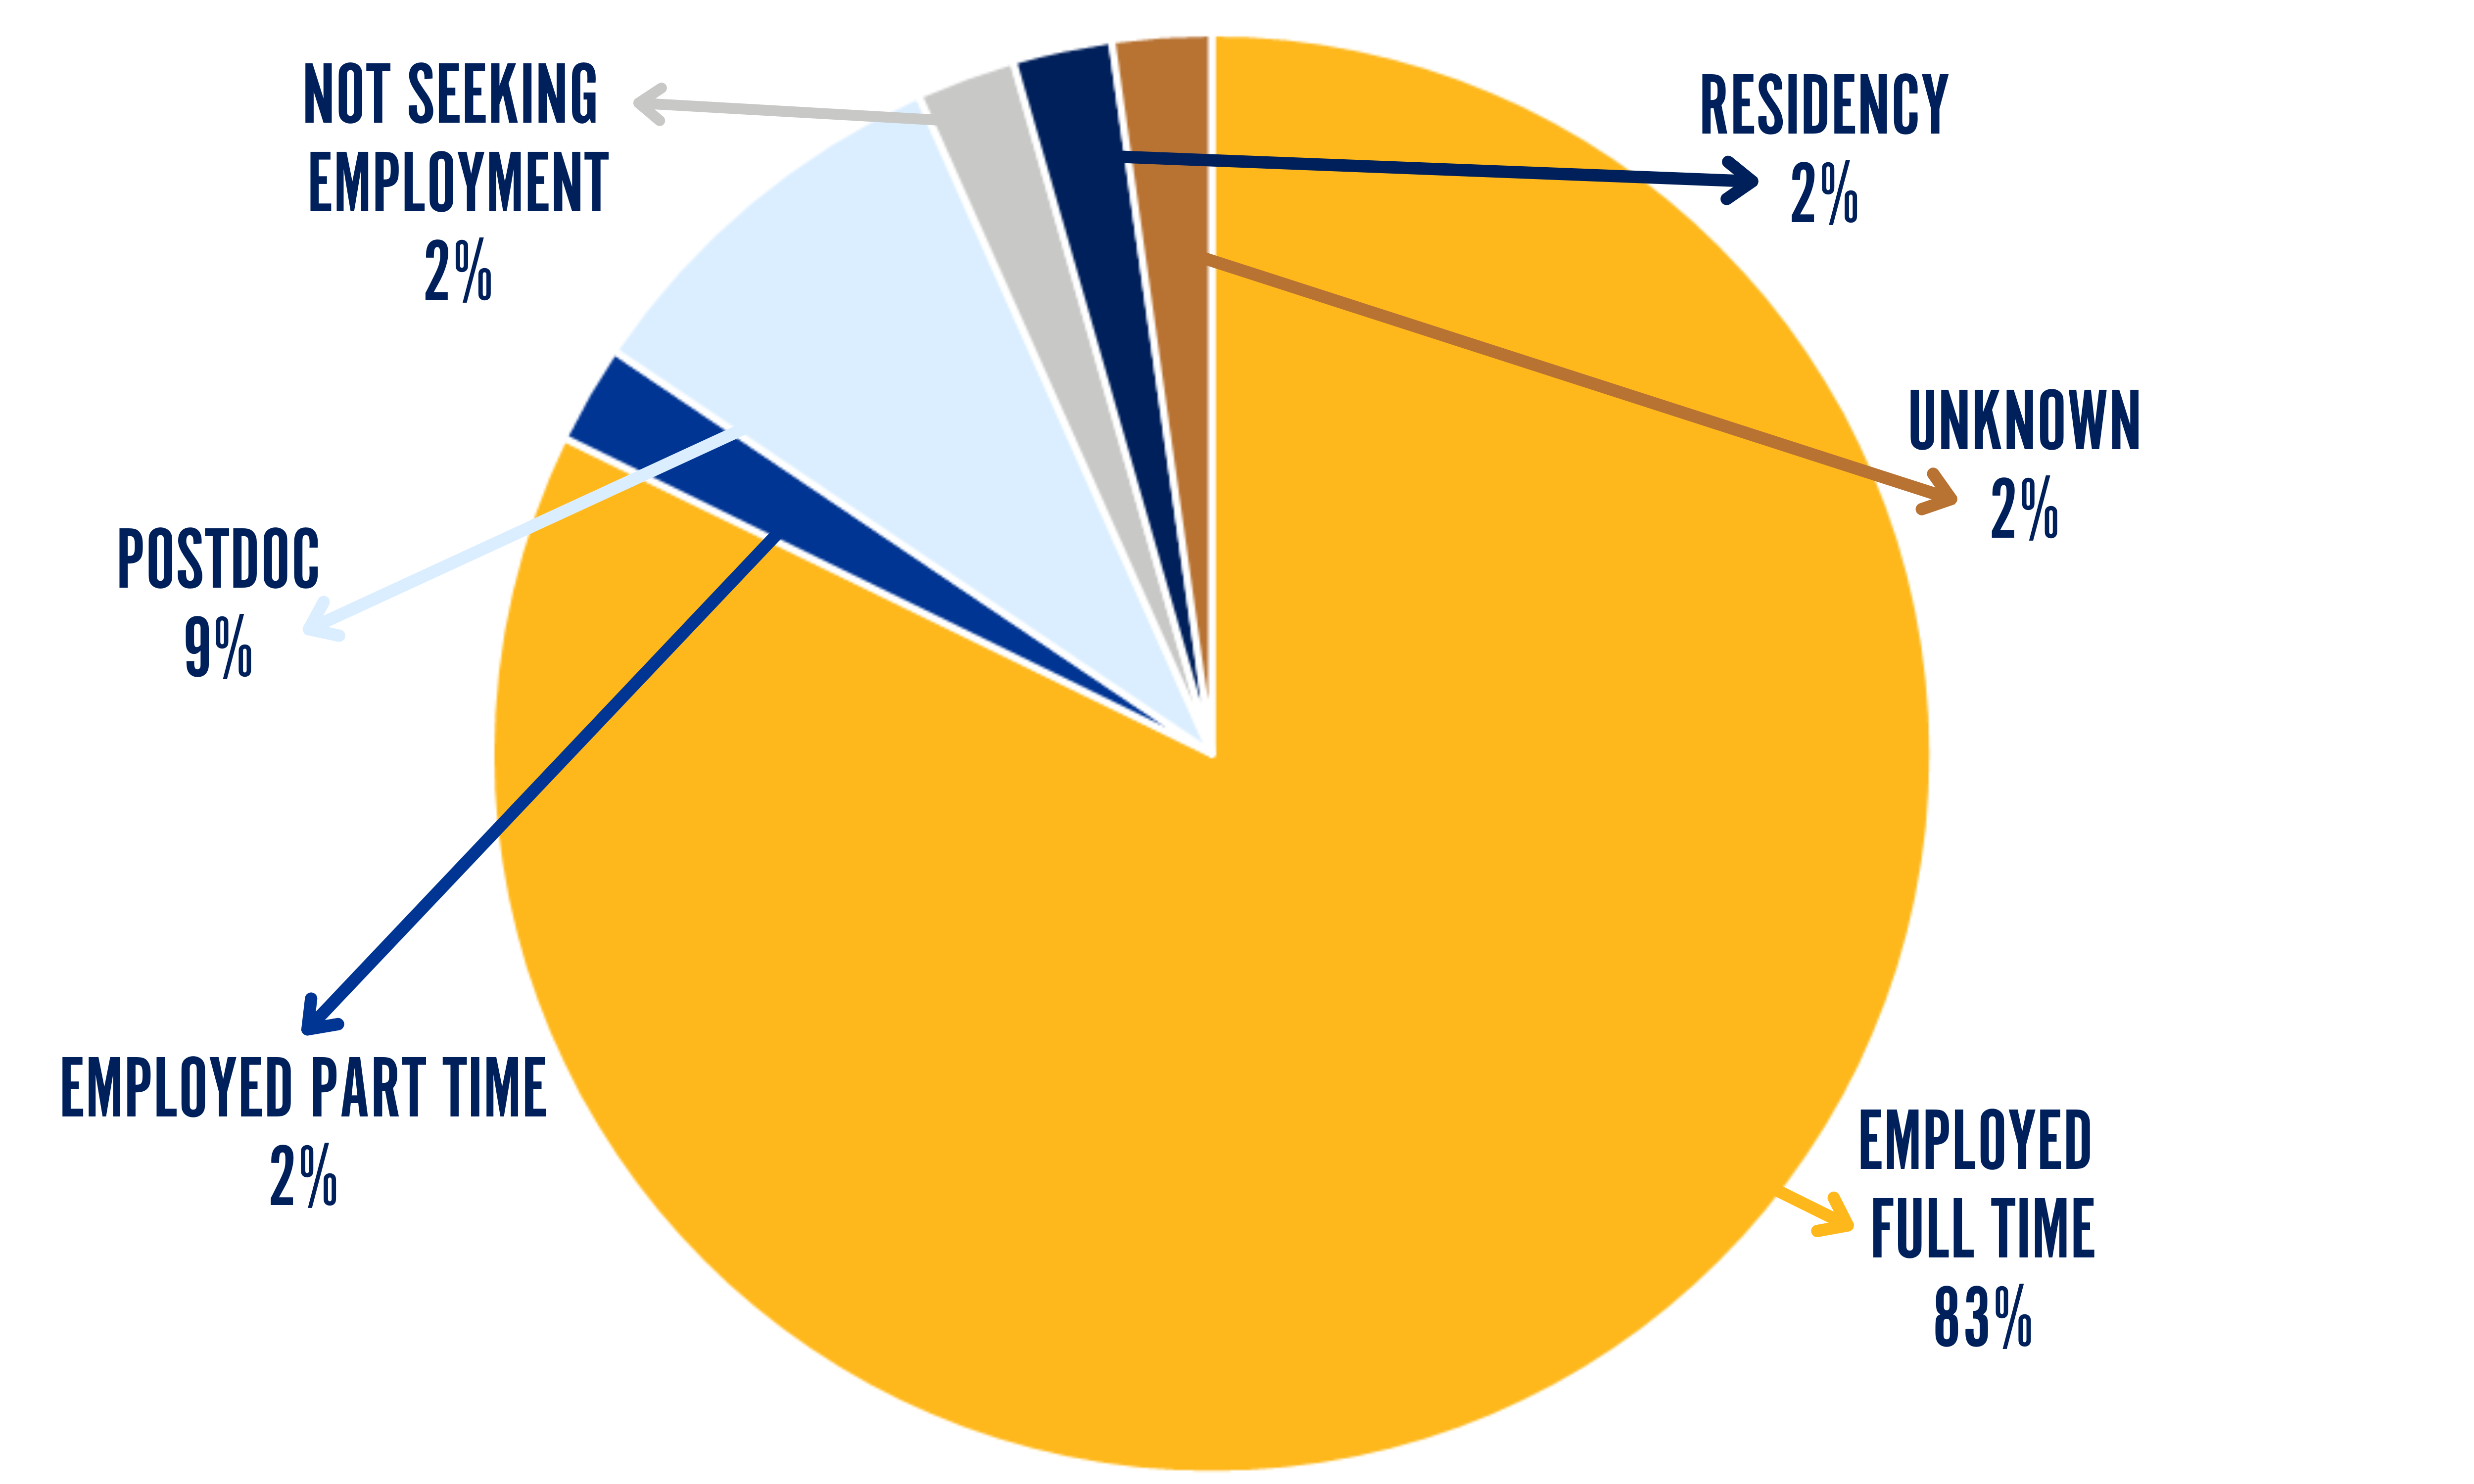
| Employed Full Time | 83% |
| Unknown | 2% |
| Residency | 2% |
| Not Seeking Employment | 2% |
| Postdoc | 9% |
| Employed Part Time | 2% |
Employment Sectors
Master's graduates
n=153
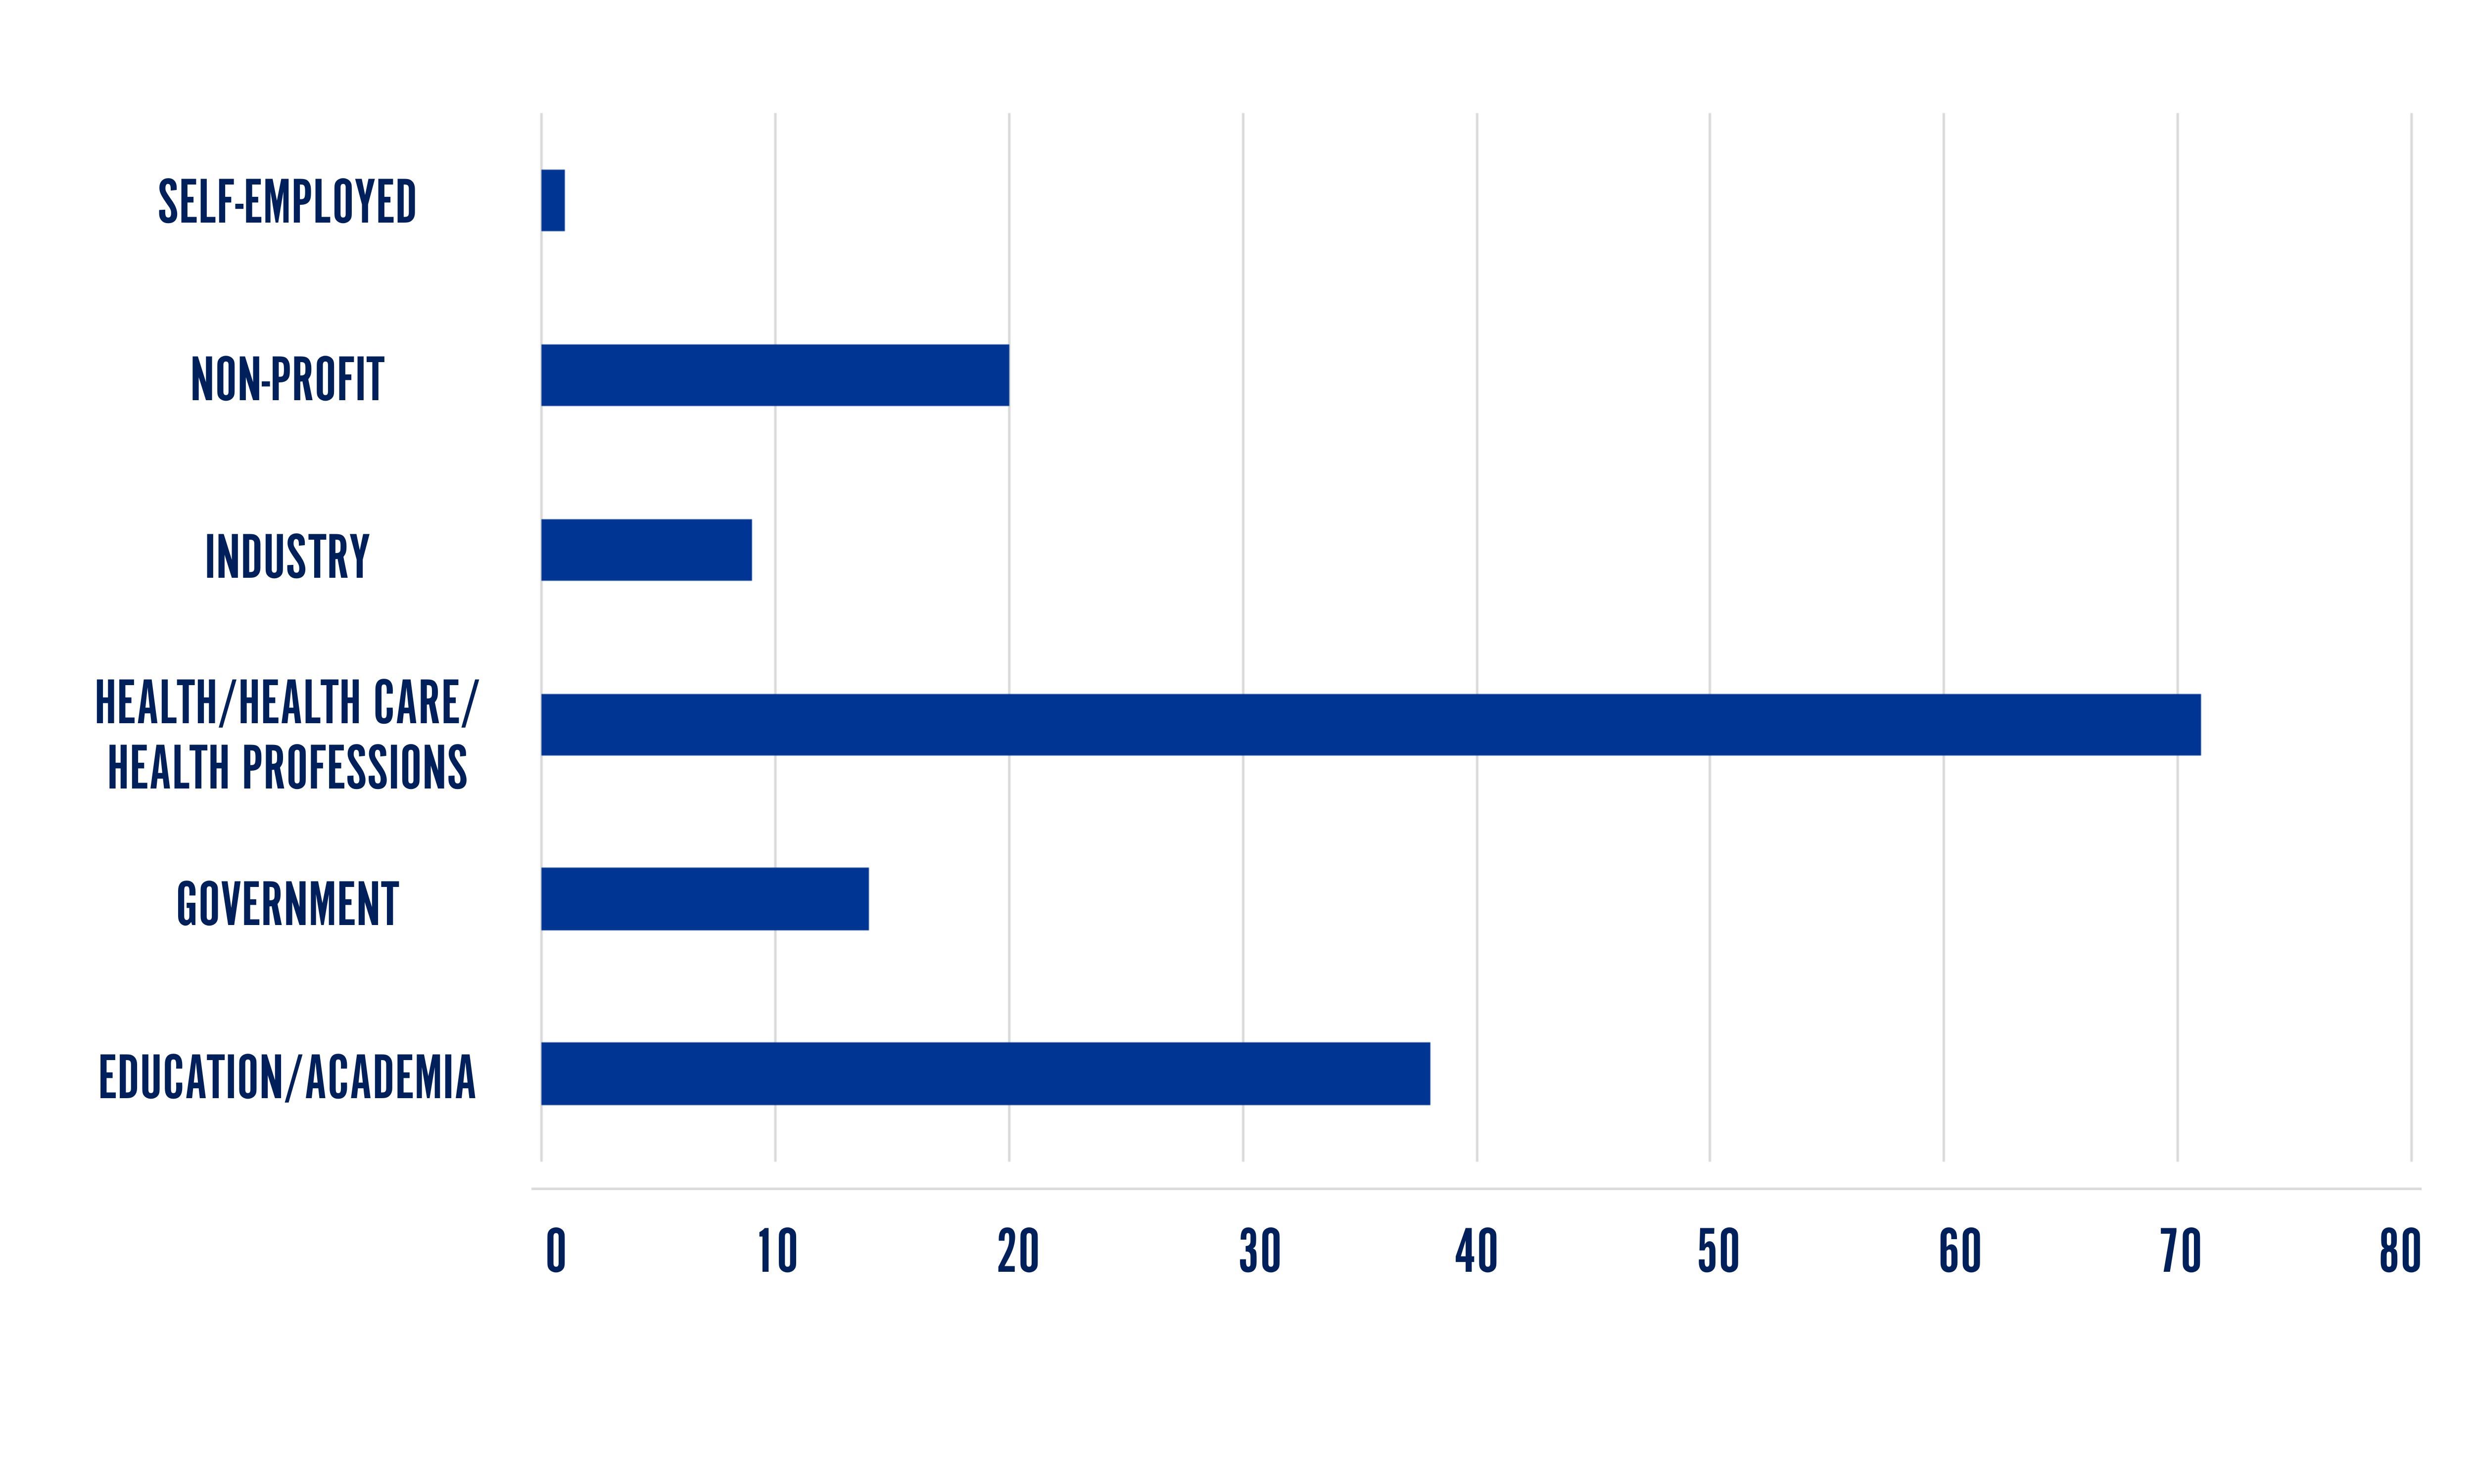
| Self-Employed | 1 |
| Non-Profit | 20 |
| Industry | 9 |
| Health/Health Care/Health Professions | 71 |
| Government | 14 |
| Education/Academia | 38 |
Doctoral graduates
n=38

| Self-Employed | 1 |
| Non-Profit | 1 |
| Industry | 14 |
| Health/Health Care/Health Professions | 4 |
| Government | 6 |
| Education/Academia | 12 |